Showing posts with label Retail. Show all posts

Tuesday, 10 July 2007

Non-Quantitive Diagrams

In my thesis I developed so called ‘Non-Quantative Diagrams’. Non Quantative diagrams do not use specific data (hence the term ‘Non-Quantative’), but show time related developments that can contribute first of all to a better understanding of the current situation and of future developments. This better understanding can be used in the tactical (short term) and strategical (long term) management.

One of the aspect we encountered in our retail projects was how to reduce the costs and at the same time to improve the quality by innovating. Due to the learning process we were able to work more efficiently and as a result to reduce the costs. Instead of enlarging our profit margin we used the cost reduction to improve the quality.

With a non-quantitive diagram we were able to illustrate possible developements to ourselves but also to the client. The diagram below shows the quality, revenue and cost versus time in the retail project that we are involved in.

In the beginning of the project,due to a learning process and improved efficiency, the costs are reduced. Given a constant revenue this leads to a growing profit margin. At a certain moment (t=1) the profit growth is used to innovate and improve the quality by initiating innovations. Off course not all innovations are in the end successful. As a matter of fact most of them are not. The way we worked we in our retail project we could afford that in certain cases we do not to succeed and therefore we felt confident to take risks in developing new products and services. This process repeats itself in a number of cycles. At the end of each cycle the quality is improved.

Concepts like Six Sigma usually focus on reducing the costs of existing projects and do not use these cost reductions to initiate innovations in new projects. They tend to kill potential innovations by taking les risks


According to an article in Business week Six Sigma almost killed the innovation at 3M. The way we worked in our retail project shows that cost reducing and improving the efficiency do not have to contradict innovation: on the contrary !

Friday, 11 May 2007

Cyclical Information Management

The amount information that you need for project, especially retail projects, can be quite extensive. From our experiences as retail architects we learned that especially in retail project the information not comes not only in large amounts, but can be extremely complex as well. Because these projects can run for a number of years, the information is likely to change which makes it even more complex. We refer to it as dynamic information.

From our experience in producing paper manuals (that are outdated from the moment they are published) and the numerous attempts of other people we decided to develop a web based dynamic information system in cooperation with ABN AMRO Bank (not one of the most boring banks at the moment). During the development, we used the cyclical concept on two levels. Firstly, the basic concept of the information system is cyclical in the way it works, and secondly the basic concept was improved in a number of cycles, mainly by feedback from the users of the information management system.

One of my colleagues, Maurits Ruis (he has by the way a very interesting weblog - SustainaBrazil - about sustainability in Brazil) is writing a book about the whole development process. The name of the book will be ‘(visual) architecture - retail banking and information management’. The book will be made available freely at the Inbo Retail site.

Thursday, 10 May 2007

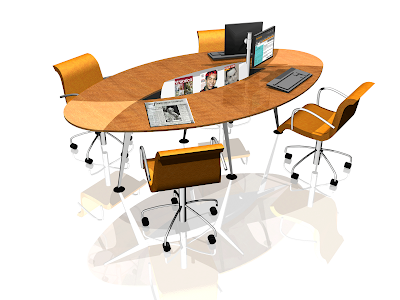
The Design of an Internet Reading Table

For the ABN AMRO Bank we designed an internet table. This is basically a table with a number of computer screens that can be used by the client to check on all kinds of financial websites. There is also a small collection of relevant newspapers and magazines for the clients.

The design of such interior components usually take several months and a large amount of money. By applying the Cyclical Iterative Design Process we were able to cut dramatically on the time from the first idea to the first production model. In all it took a period of six weeks. After the first virtual model was build and evaluated the first prototype was build. The client, we as the designers, and the contractor met together to test and evaluate the table. It was decided that a number of changes should be made. The legs of the table should be of a different shape in order to match the existing furniture line. The lighting of the white element in the middle of the table should be done with LED lights in stead of tube lights. These changes where realized within two weeks and again evaluated. The pictures below show the second evaluation meeting.


Two weeks after this second evaluation the first production model was finished.
After a period of six months the table was again evaluated and some aspects were changed. The whole design process is illustrated below.


As we analyzed and evaluated the table there where vivid discussions, and coffee was of course an essential requirement. This lead us to the following statement:

“The success of a prototype can be measured by the number of coffee stains on it ...”